Real-Time Graphics Infrastructure for Live Election Coverage
How I designed and documented a complete live graphics system that enabled distributed contractors to execute complex broadcast graphics in real-time during high-stakes election coverage, with zero margin for error.
The Washington Post Video Department | 2016-2025
The Challenge
Live election coverage is one of the most demanding environments in broadcast journalism. Results change every 30 seconds. Graphics need to update in real-time. There's no room for errors when millions of viewers are watching.
Major news organizations typically staff election night with 15-20 motion graphics artists working in shifts. We had a 3-person core team and needed to deliver the same quality across primary elections, midterms, and presidential races, often with simultaneous state and national coverage.
The traditional approach (designers manually creating each graphic) doesn't work when vote counts update continuously and winner calls happen unexpectedly. We needed a fundamentally different system.
The Scale of the Challenge
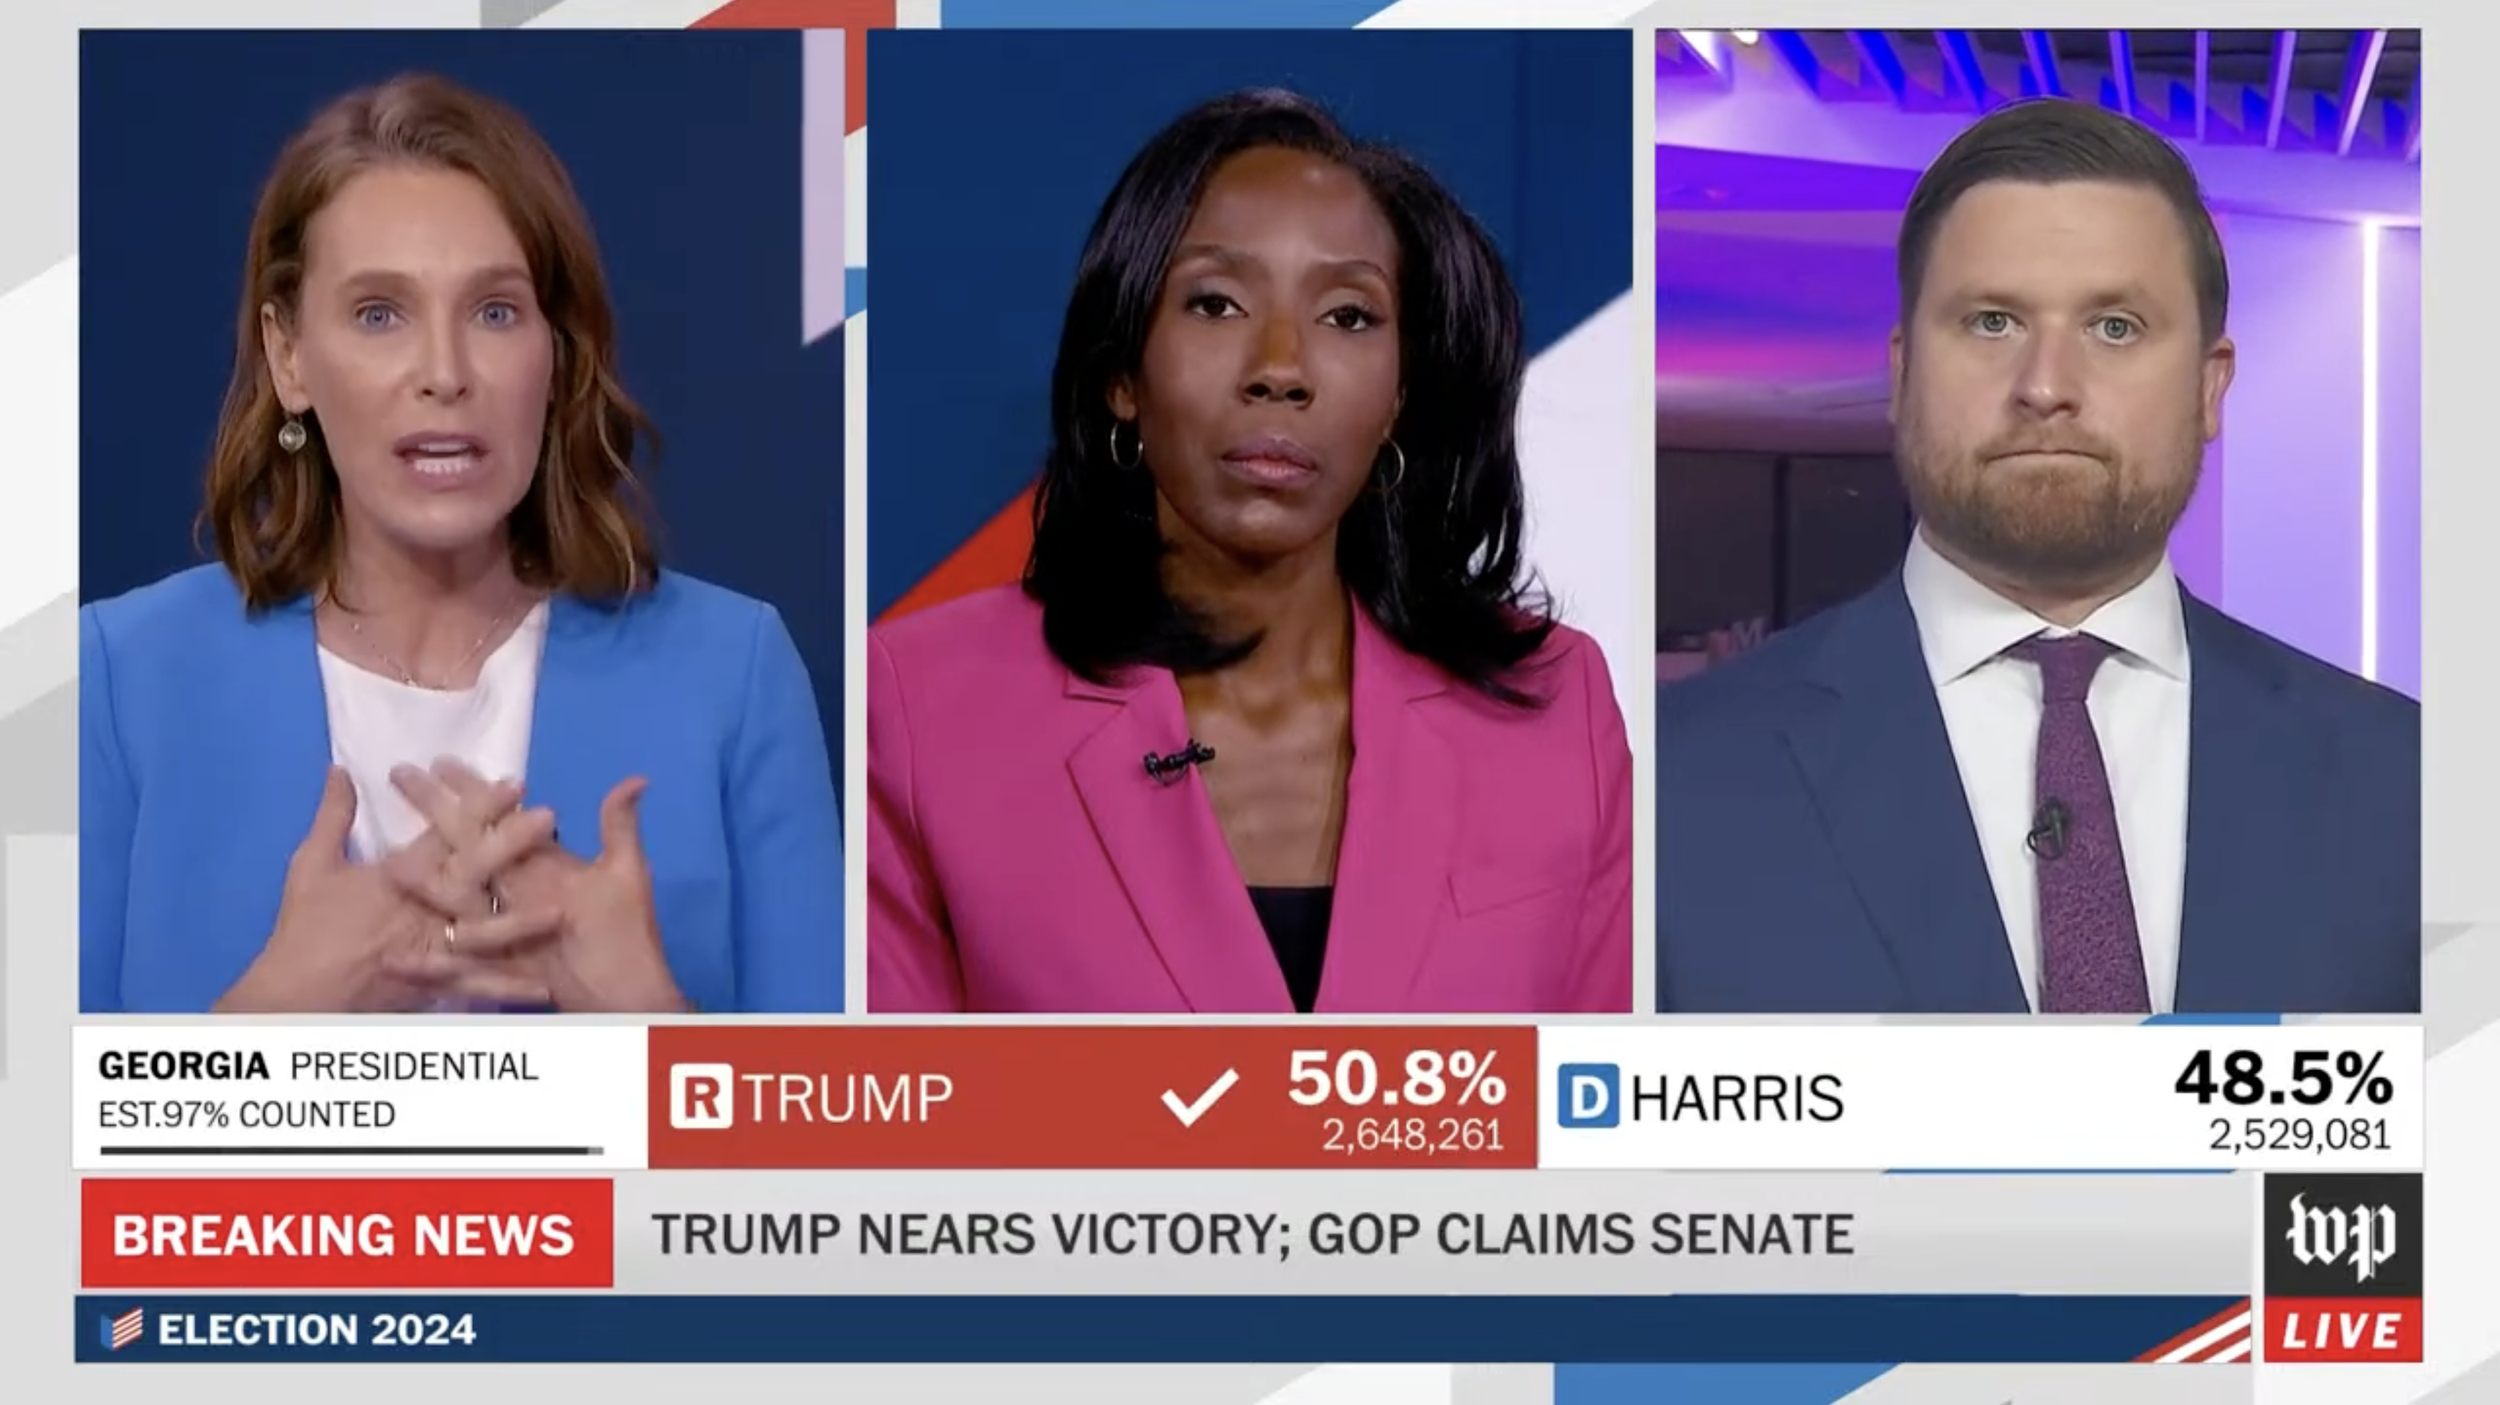
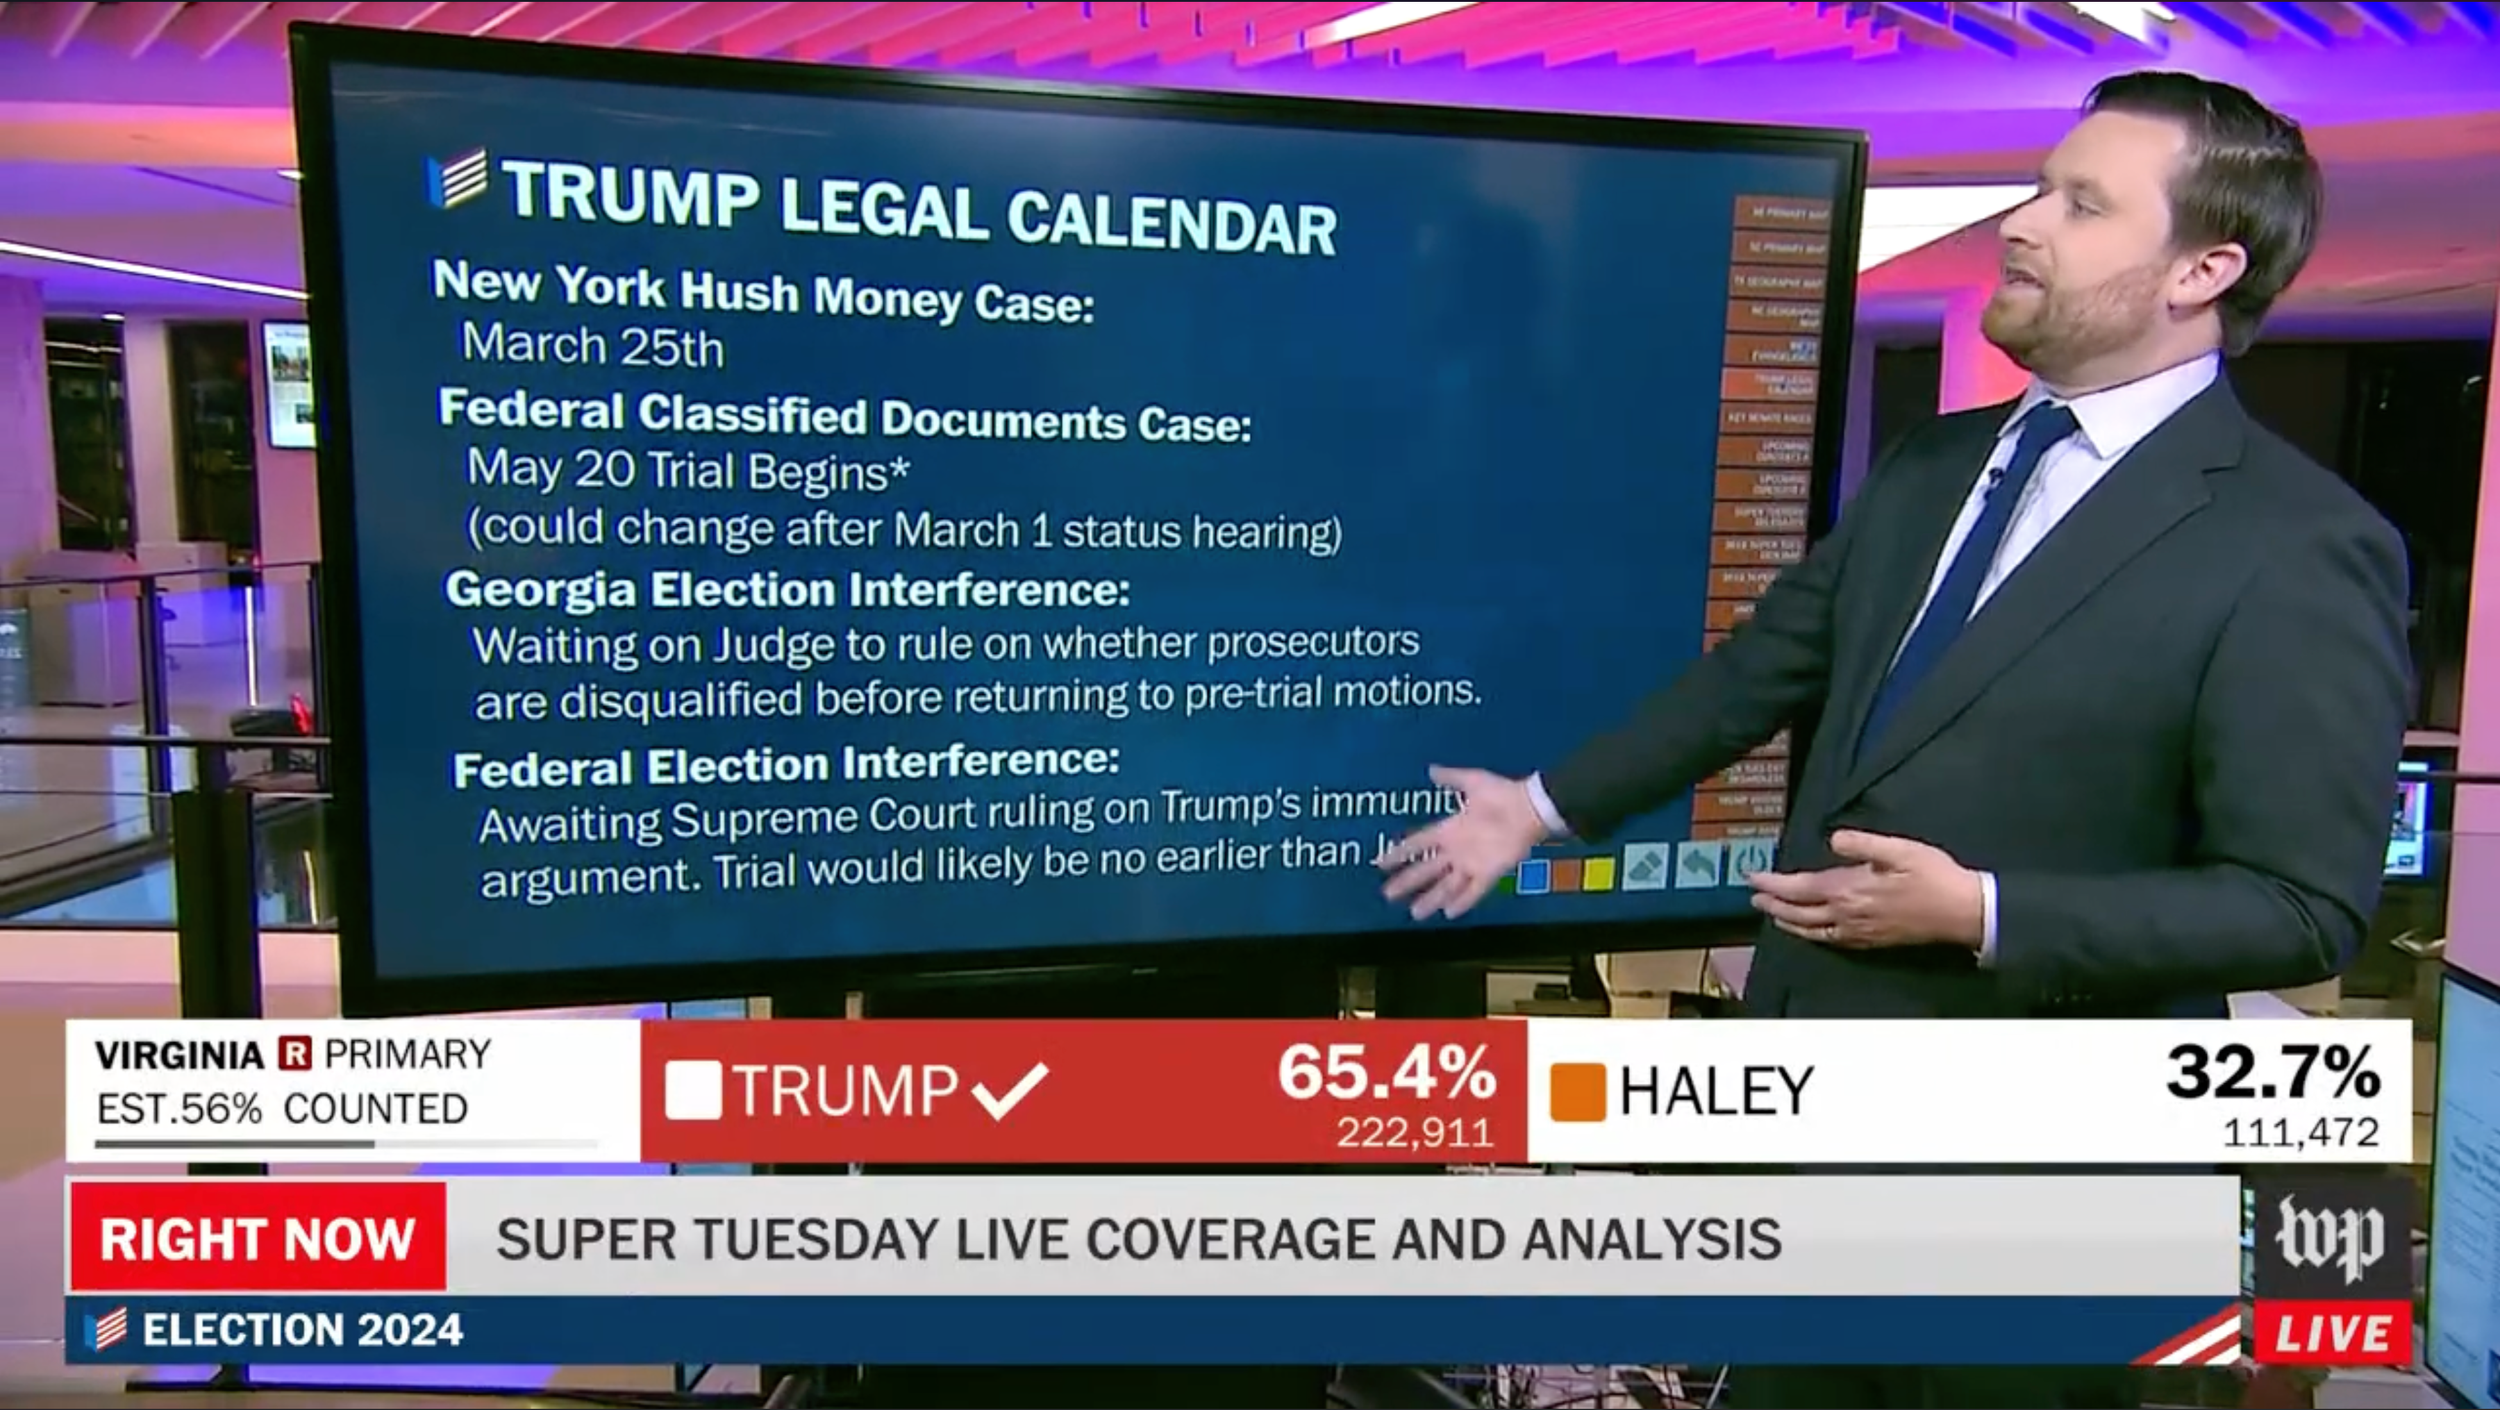
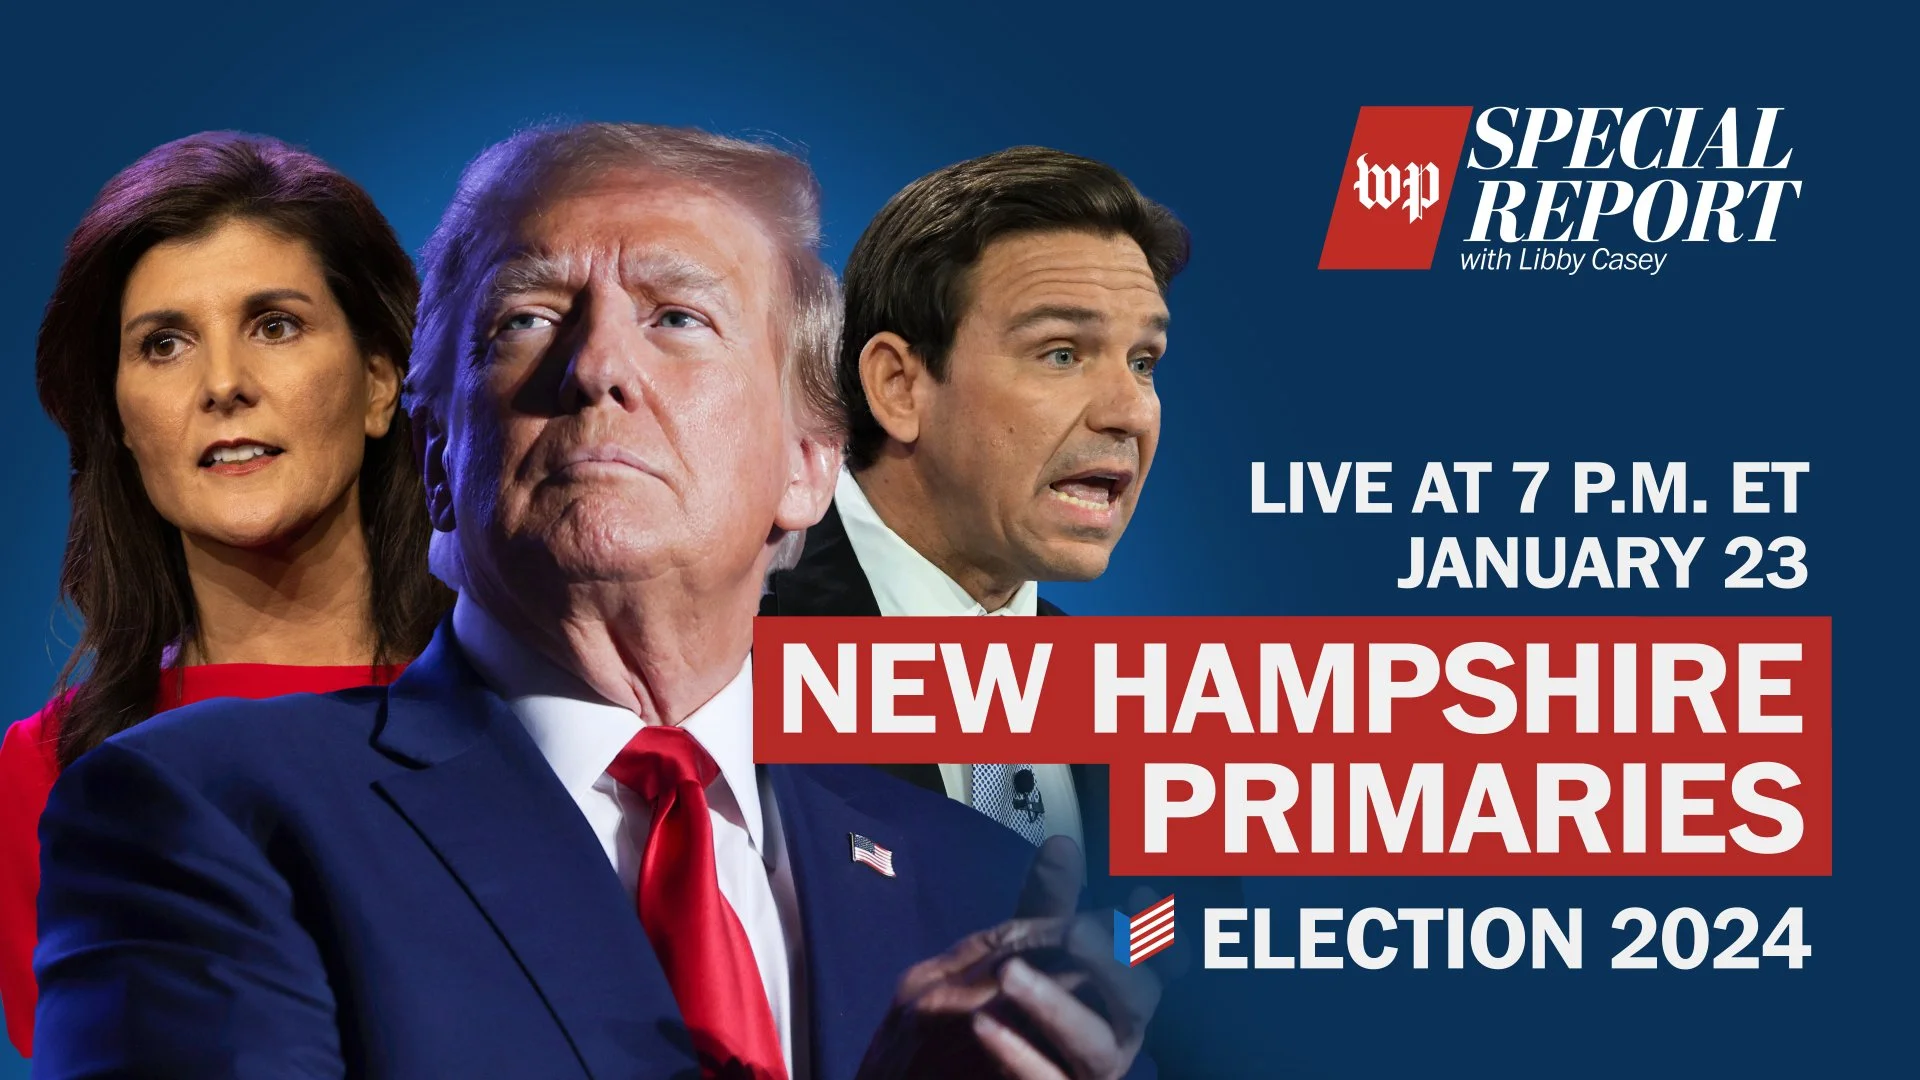
Election night requires dozens of simultaneous graphic elements: live vote counts, winner boards, breaking news banners, analyst name cards, county-by-county maps, delegate trackers, exit poll data, and real-time headlines. All updating dynamically. All needing to maintain brand consistency. All with zero tolerance for on-air mistakes.
The Solution: A Template-Based Live Graphics System
Rather than throwing more people at the problem, we redesigned the entire production workflow. I architected a complete live graphics infrastructure in Brainstorm (broadcast graphics software) that allowed a single graphics operator to manage 50+ live elements simultaneously—without design team intervention.
The System Architecture
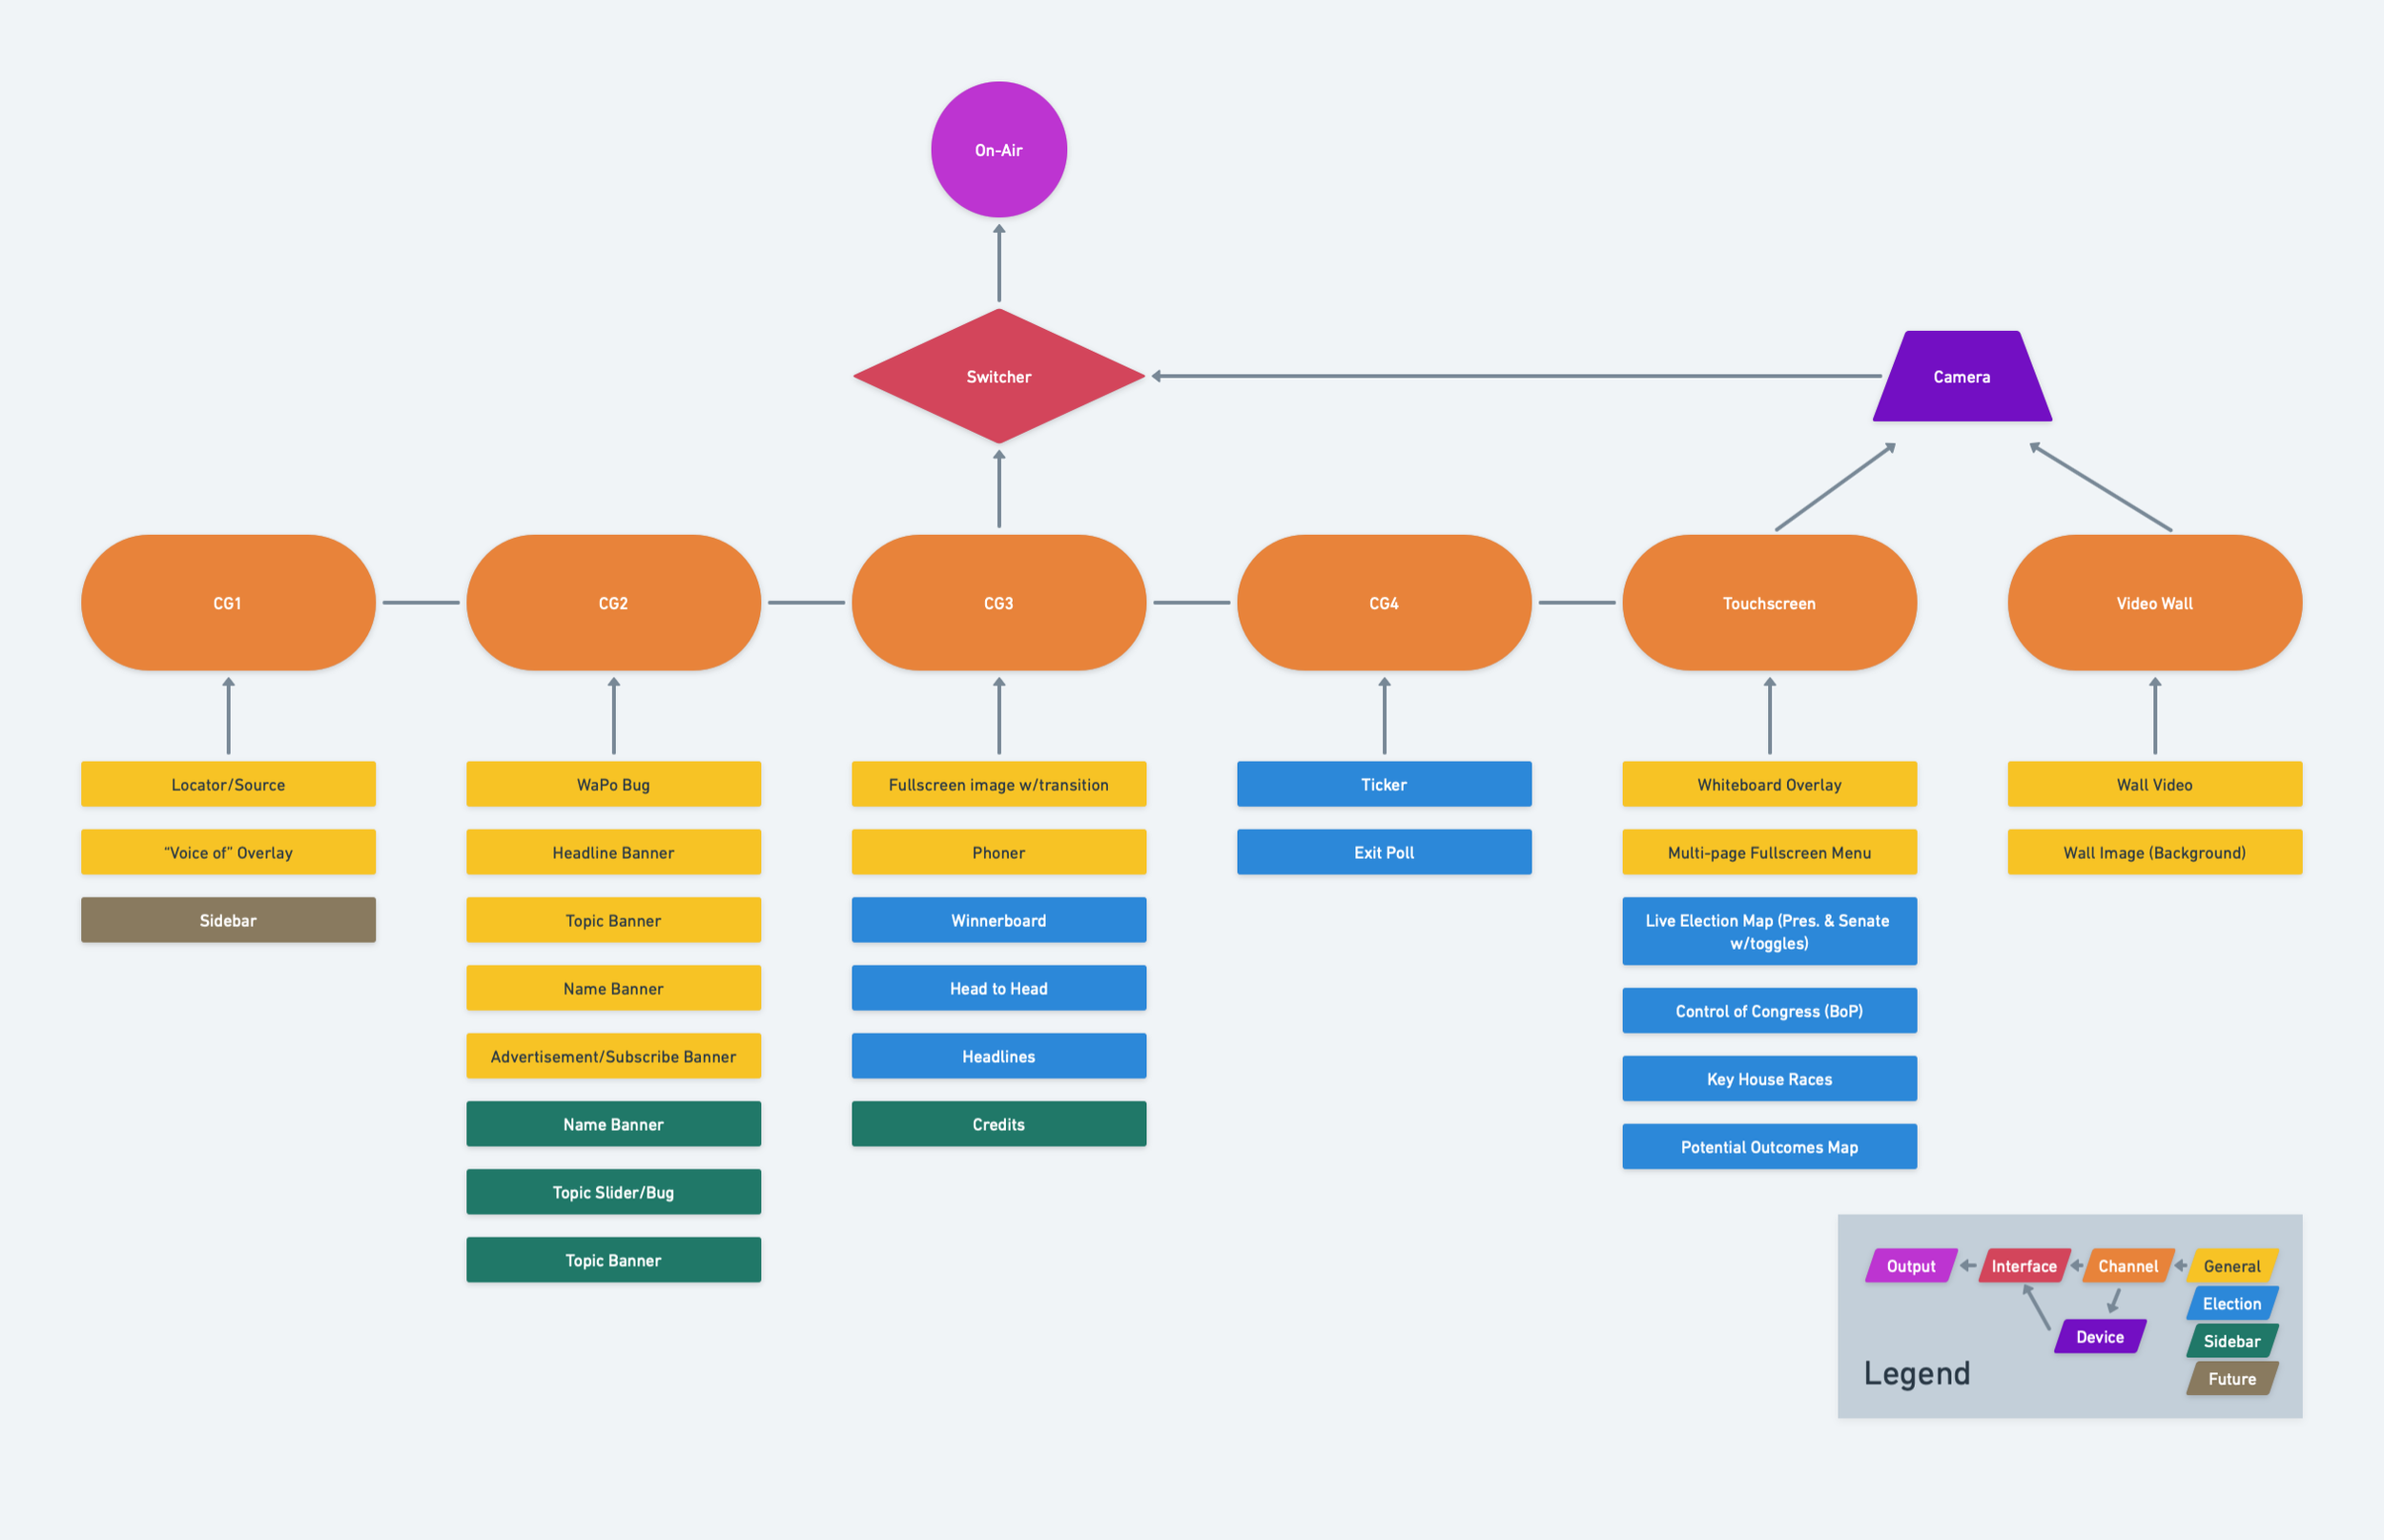
I designed a hierarchical template system organized into four layers, allowing operators to stack multiple graphics without conflicts:
What Made This Different
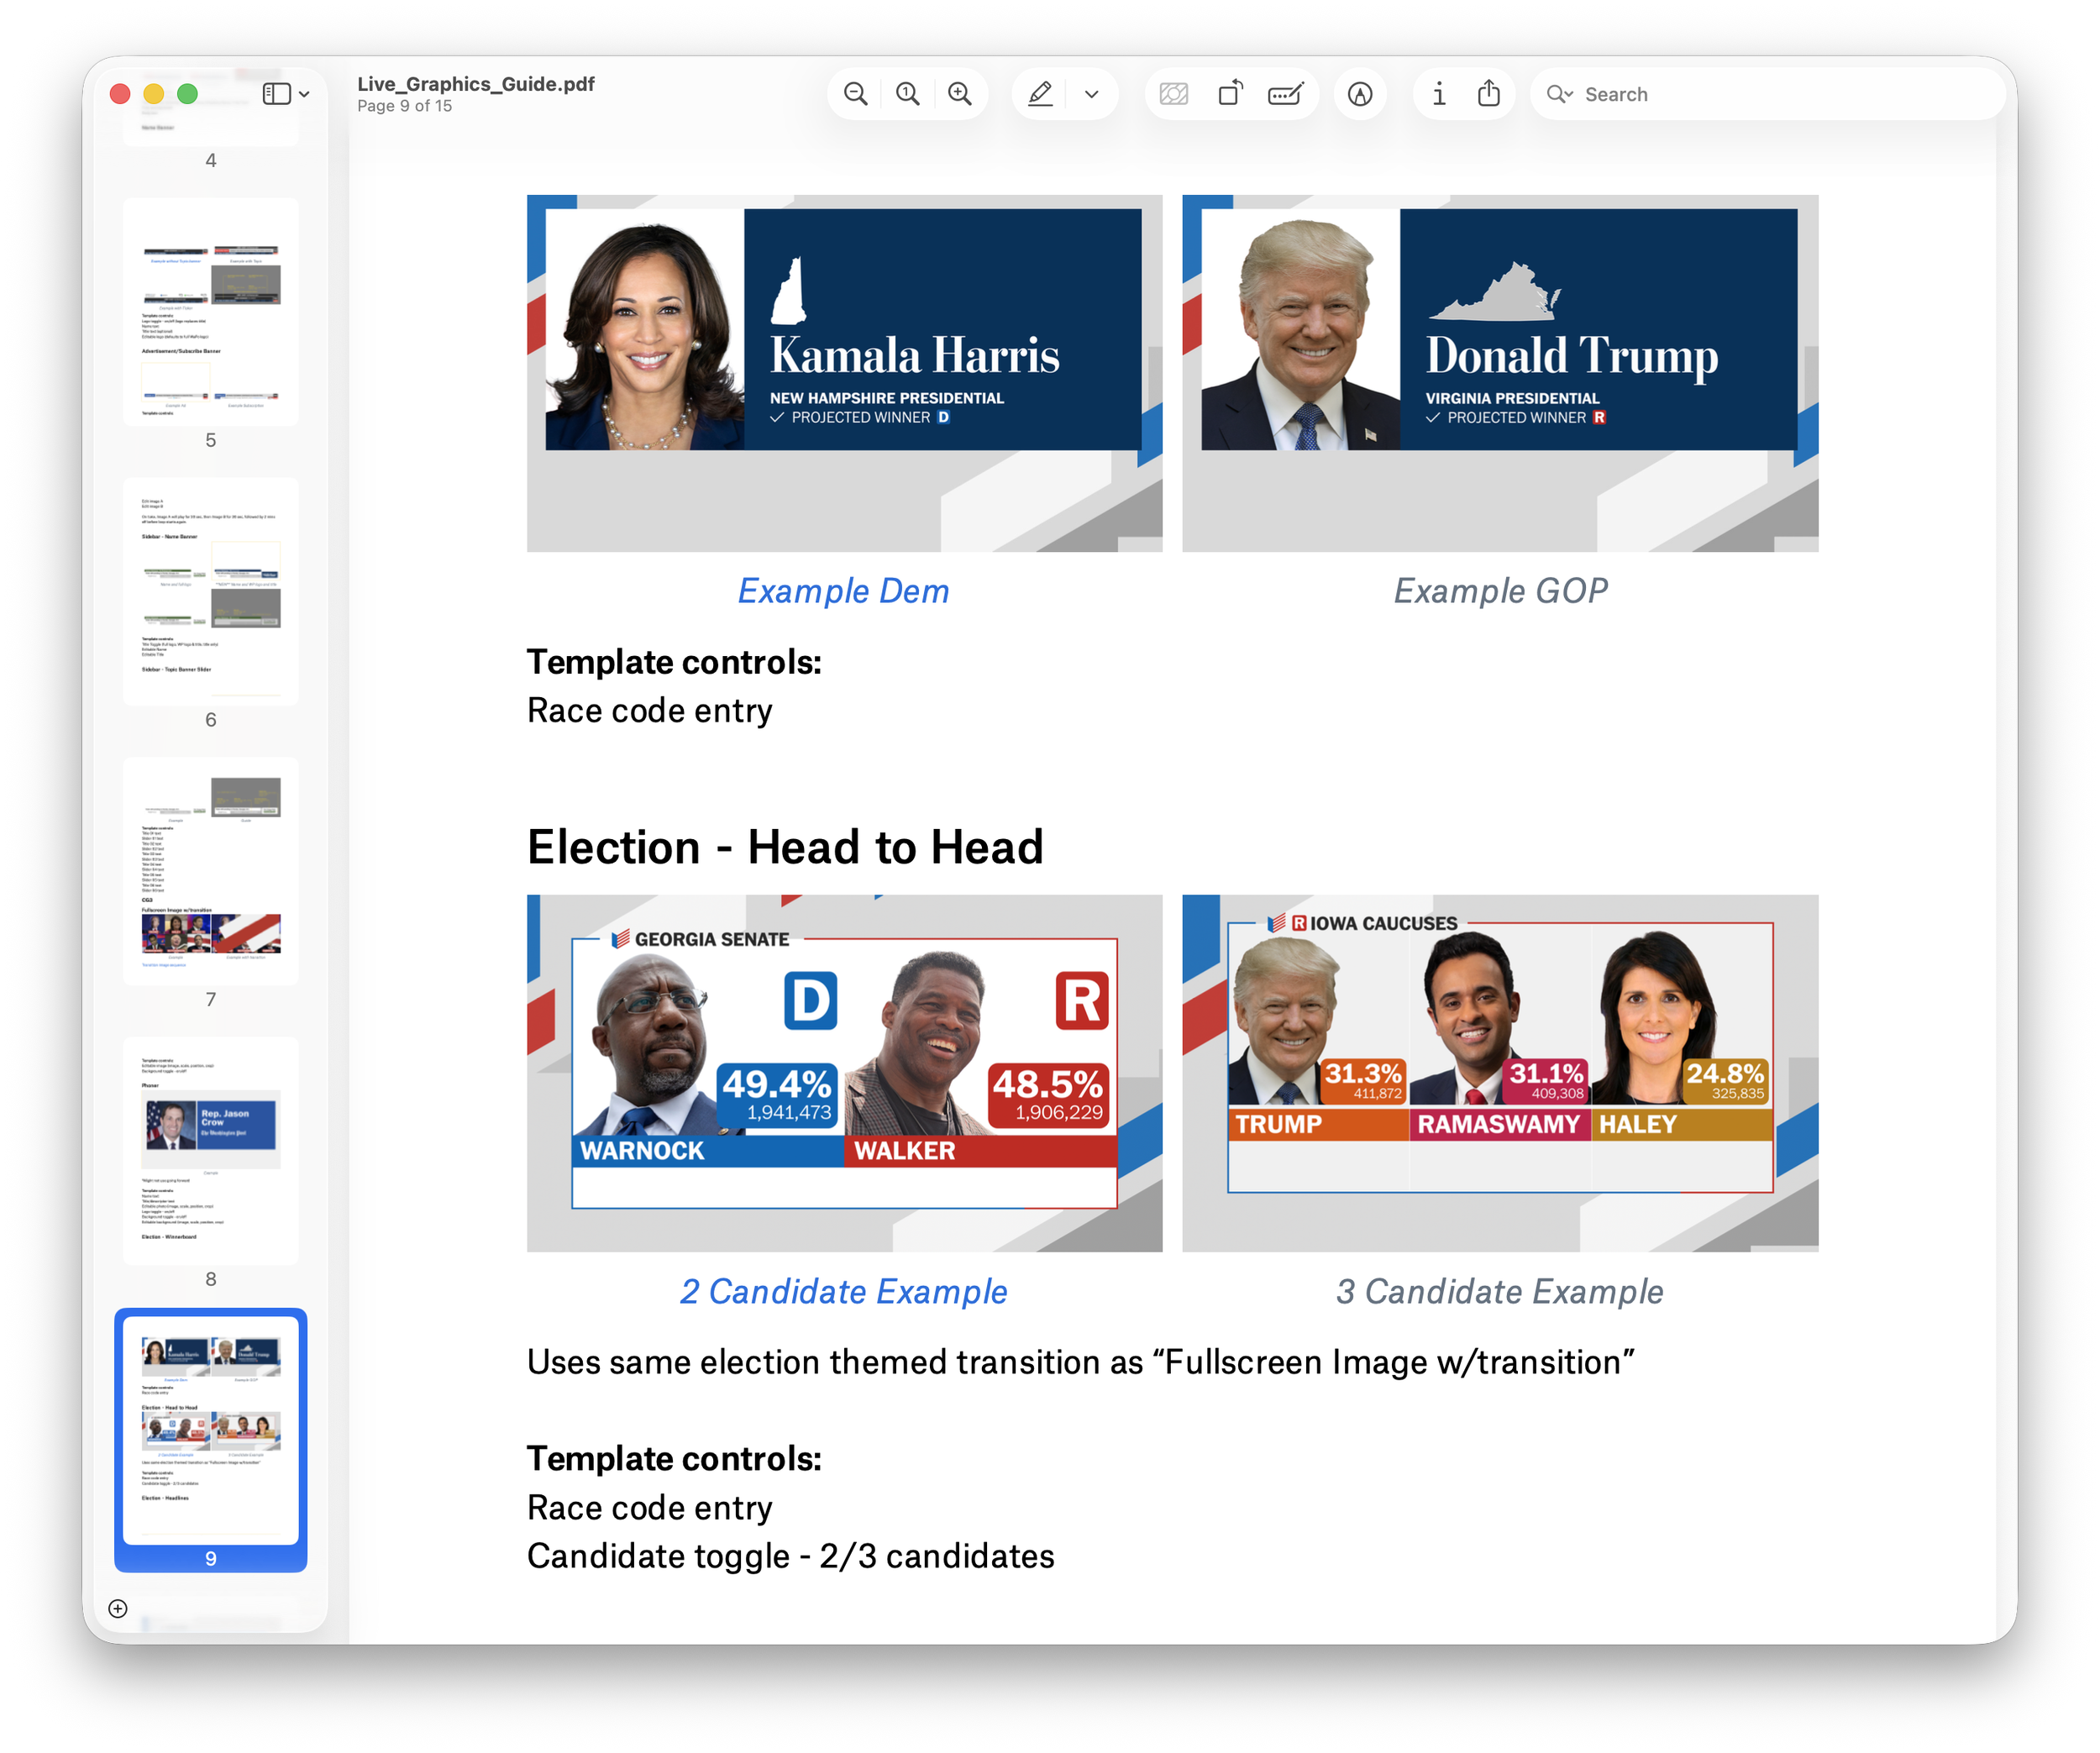
Each template wasn't just a design. It was a parameterized system with:
Toggle controls (on/off options for various elements)
Text fields with character constraints
Image slots with positioning/cropping controls
Color selectors for party affiliation
Automated data integration for live vote counts
Built-in animation timing
The system prevented operator error by only exposing valid options. You couldn't accidentally create an off-brand graphic because the templates encoded all design decisions.
Building a System That Others Could Execute
The real challenge wasn't just designing the graphics. It was enabling a distributed team to execute them flawlessly during live broadcasts.
Comprehensive Technical Documentation
I created a complete operator guide with:
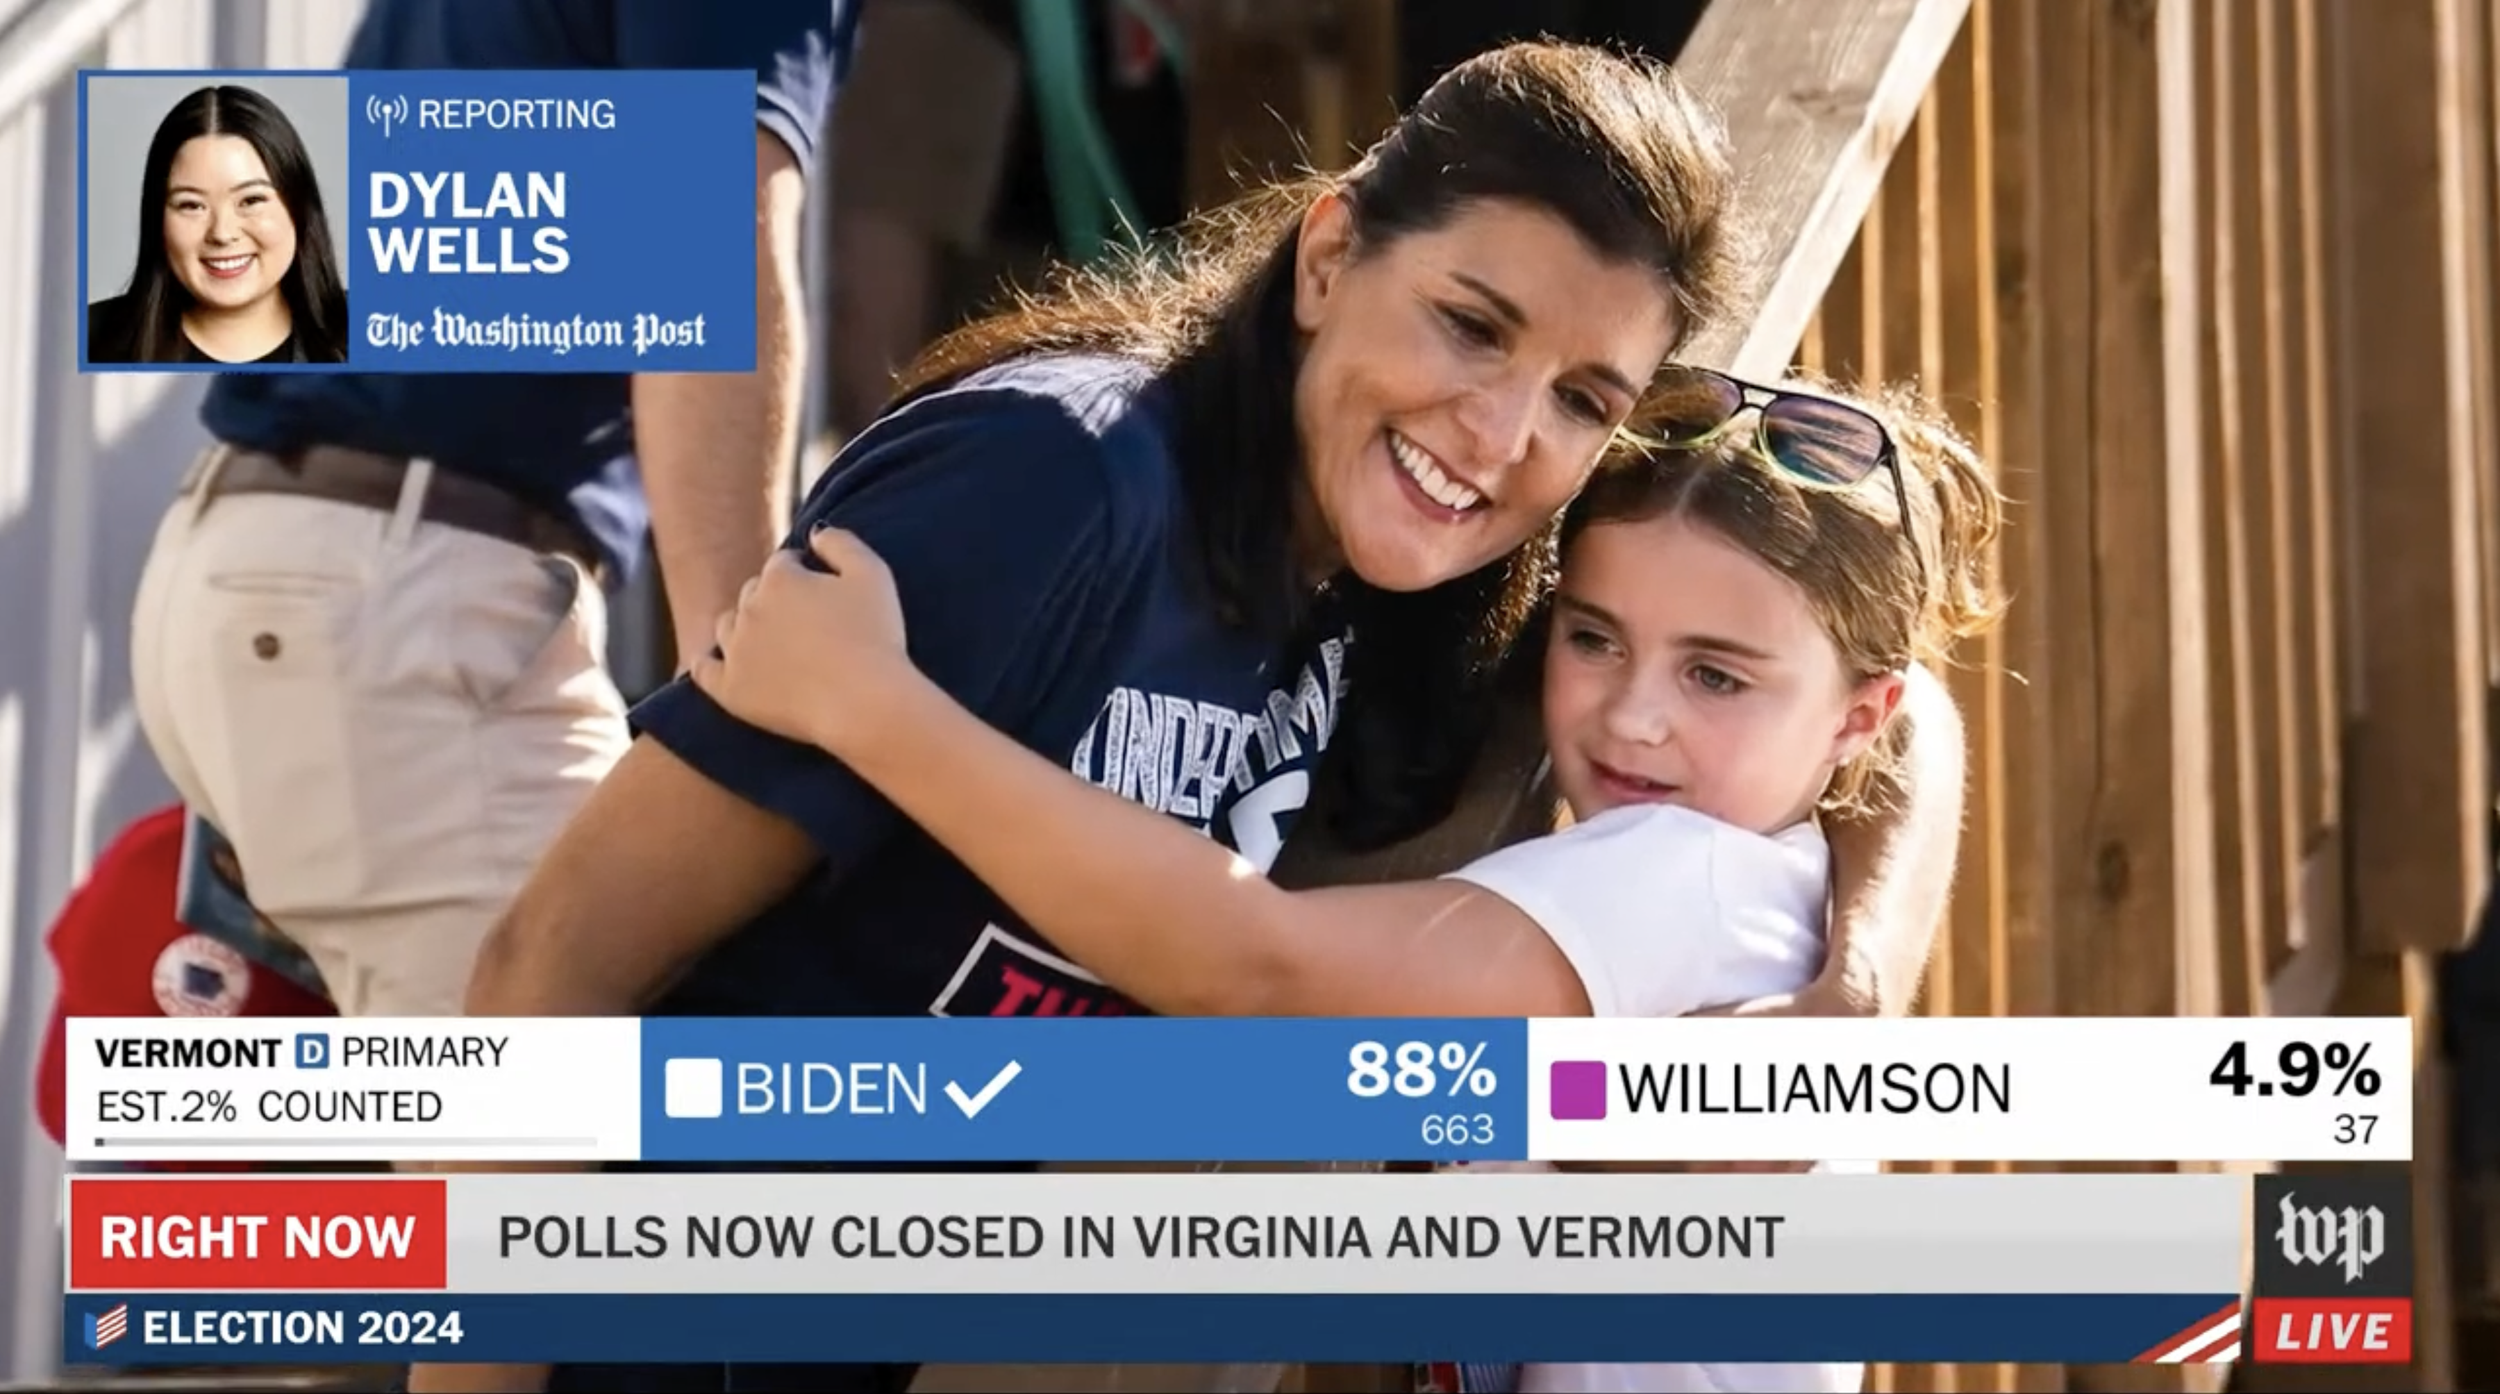
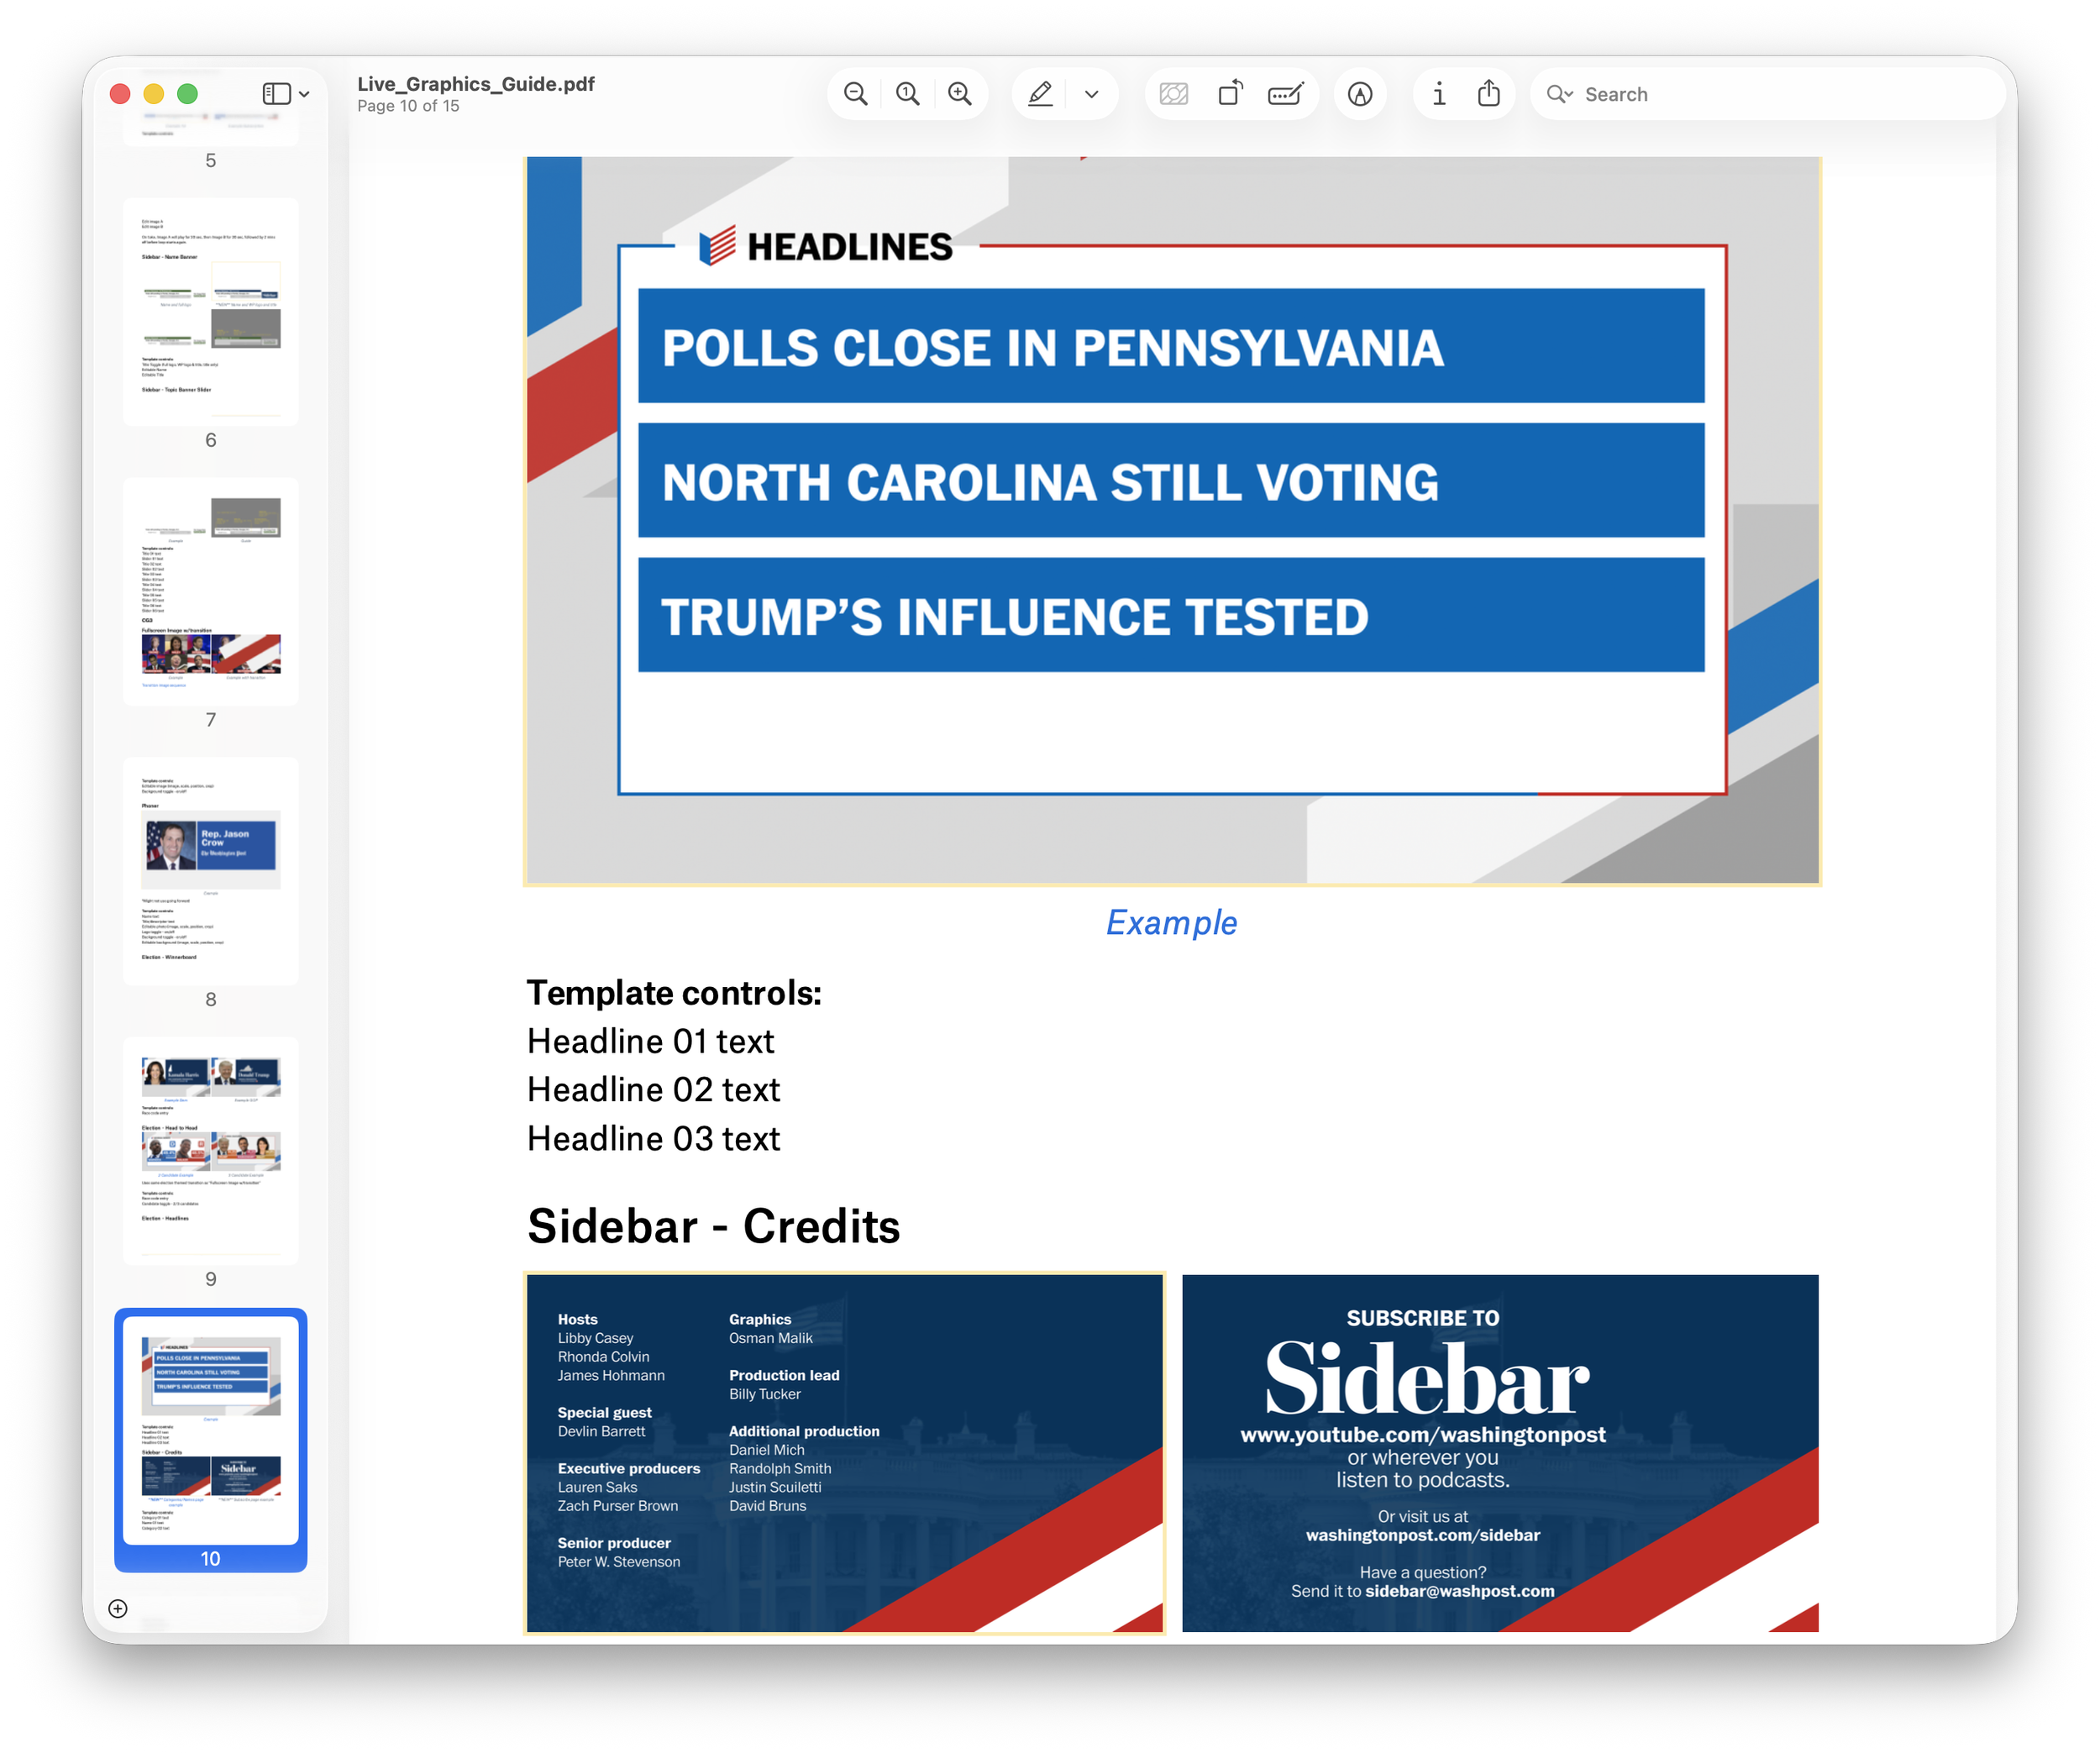
Visual Examples:
Every template shown with actual on-air examples and annotated screenshots showing editable parameters
Technical Specifications:
Detailed breakdown of every control, toggle, and text field for each graphic
Workflow Diagrams:
Decision trees showing which graphic to use in specific scenarios (speaker on-screen vs. voice-over, captioned vs. uncaptioned video, etc.)
Edge Case Handling:
Notes on special situations and future enhancements
Contextual Instructions:
When to use each graphic, how they layer together, timing considerations
Why Documentation Mattered
This system enabled a graphics operator in Spain to execute designs I created in DC during live election broadcasts, with zero latency for design approval. The templates encoded all brand standards upfront, and the documentation provided the operational knowledge needed to make real-time decisions under pressure.
Distributed Team Coordination
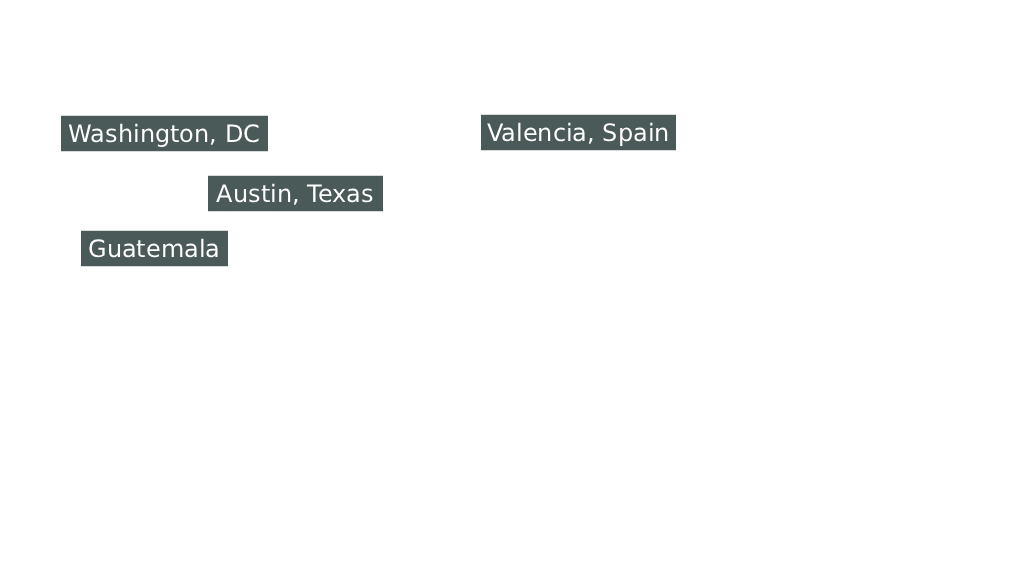
For each election, I coordinated contractors across four time zones:
DC (core team)
Austin, Texas
Guatemala
Spain
The documentation system allowed each operator to work independently while maintaining consistency. Clear handoff procedures, asset libraries, and timezone-optimized workflows meant we had 24/7 coverage when needed.
The Results
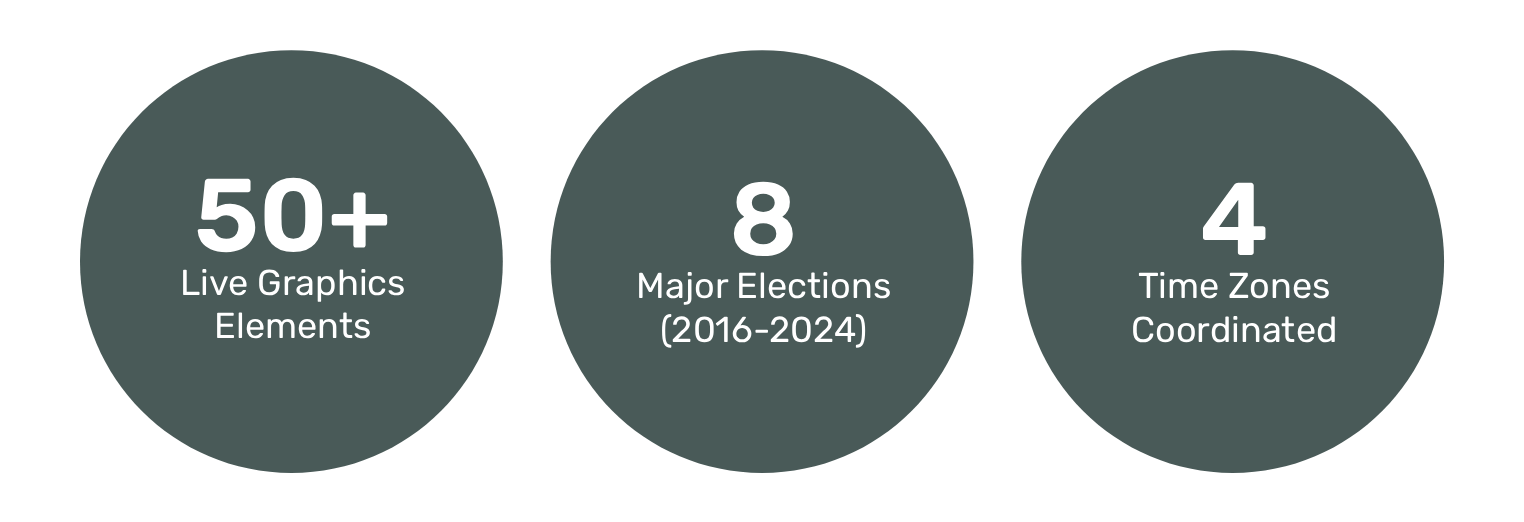
The system delivered across 8 major elections from 2016-2024:
Matched competitor output with 80% fewer people: Our 3-person core team + 2-4 contractors delivered what other organizations needed 15+ people to achieve
Real-time responsiveness: Vote counts and winner calls updated within seconds of data availability
Consistent quality across elections: The system worked identically for primaries, midterms, and presidential races
Knowledge transfer without training bottlenecks: New operators could learn the system through documentation alone
Cost efficiency: 70% reduction in personnel costs compared to traditional staffing models
What This System Required
Building infrastructure for live broadcast operations demanded different thinking than traditional design work:
Real-Time Data Integration
Graphics connected to live election APIs, automatically updating vote counts and winner calls as results came in. The system had to handle data refreshes every 30 seconds without disrupting on-air graphics.
Fail-Safe Design
Every template included fallback states and error handling. If data failed to load, graphics displayed placeholder content rather than breaking entirely.
Performance Under Pressure
Graphics had to render instantly when triggered. No loading delays, no lag, no buffering. When a winner was called, the graphic appeared on-screen within 2 seconds.
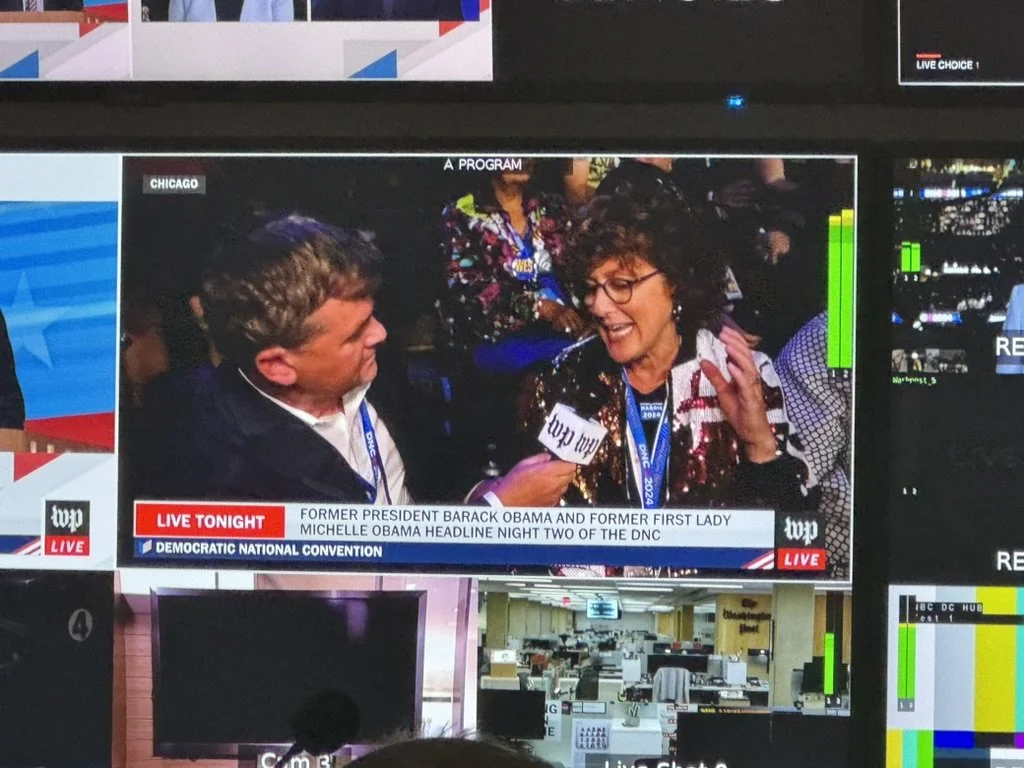
Multi-Output Coordination
Single graphics source fed multiple outputs: main program feed, video wall, touchscreen displays, streaming platforms. All synchronized perfectly.
Key Success Factors
1. Documentation as Operational Infrastructure
The comprehensive guide wasn't just nice-to-have, it was mission-critical infrastructure. Without it, distributed teams couldn't operate independently. The documentation transformed tacit knowledge into explicit systems.
2. Parameterized Design That Prevents Errors
By encoding design decisions into template parameters, we eliminated the “creative freedom to make mistakes.” Operators could work confidently because invalid choices weren't possible.
3. Hierarchical Organization That Scales
The CG1-CG4 layer system meant operators could manage complexity systematically. Graphics stacked predictably without conflicts, allowing dozens of simultaneous elements on-screen.
4. Testing Under Real Conditions
We didn't just build and hope. Every template was tested under actual broadcast conditions with real data feeds and live operators. We caught edge cases before they became on-air problems.
Key Insight
“At the end of the day, it’s about how we provide journalism that’s credible, reliable, and trustworthy in ways that are accessible to the audience”
Catherine Kim, NBC News executive vice president of editorial
Beyond Election Night
This wasn't just an election graphics system, it was a blueprint for how to architect operational infrastructure for high-stakes, real-time creative work.
The principles applied here translate directly to any environment where:
Multiple team members need to execute consistently
Real-time constraints don't allow for approval cycles
Quality standards are non-negotiable
Distributed teams must coordinate seamlessly
Documentation must enable independent operation
Whether it's live broadcasts, rapid-response social content, or real-time marketing campaigns, the same systems thinking applies: build infrastructure that encodes quality, document it comprehensively, and empower teams to execute without bottlenecks.
Continuous Improvement
The system wasn't static—it evolved across 8 elections:
2016 Primaries & General: Initial system with basic templates
2018 Midterms: Added touchscreen integration and expanded ticker
2020 Primaries: Introduced pandemic-era remote workflows
2020 General: Refined real-time data integration
2022 Midterms: Streamlined multi-state coverage
2024 Primaries: Enhanced distributed team coordination
2024 General: Peak optimization with full automation
Each election taught us something new. Each refinement made the next election smoother. That's the nature of good operational systems—they compound over time.